
Freight Rate & Trucking Update
Trucking News – US Freight Rates
December 16, 2025 – Courtesy of DAT Trendlines
| December 2025 Freight Rates | |||
| Dec 08 – Dec 14 vs. Dec 01 – Dec 07 | Nov 2025 vs. Oct 2025 | Nov 2025 vs. Nov 2024 | |
| Spot Market Loads | -10.4% | -21.5% | +20.6% |
| Spot Market Capacity | +2.8% | -8.5% | -21.7% |
| Van Load-To-Truck | -13.7% | -9.5% | +44.1% |
| Van Rates (Spot) | +1.5% | +0.5% | +0.5% |
| Flatbed Load-To-Truck | -5.1% | -23.1% | +70.7% |
| Flatbed Rates (Spot) | -1.2% | -1.5% | -1.2% |
| Reefer Load-To-Truck | -14.5% | -3.6% | +86.8% |
| Reefer Rates (Spot) | +0.4% | +0.0% | +0.9% |
| Fuel Prices | -1.6% | -3.7% | +5.4% |
Van Freight Rates – December 16, 2025
DAT.com’s December 16th Trendlines Report shows current national van rate averages are at $2.24 per mile, 15¢ more than the November average. According to DAT, the highest average van rates are in the Midwest at $2.41 per mile. The lowest average van rates are in the Northeast at $1.98 per mile.
DAT reports the current national load-to-truck ratio is 8.56 loads-to-truck, compared to the November average of 5.55. Ratios are high across most of the states. The lowest ratios are in the Midwest.

Reefer Freight Rates – December 16, 2025
Reefer freight rates are averaging $2.62 per mile, 8¢ higher than in November. Reefer rates are highest in the Midwest, averaging $2.97 per mile. The lowest rates are in the Southeast, with an average of $2.22 per mile.
National reefer capacity is at 14.69 loads-to-truck compared to the November average of 10.88 loads-to-truck. Current load-to-truck capacity shows reefer demand is highest in the Northern and West Coast states. The Southeastern states have the lowest load-to-truck ratios.

Flatbed Freight Rates – December 16, 2025
National average flatbed rates are $2.52 per mile, 5¢ more than the November average. The Southeast and Midwest have the highest average flatbed rates at $2.64 per mile. The lowest rates are in the West, with an average of $2.23 per mile.
Nationally, load-to-truck ratios are at 26.4, compared to 18.99 in November. Load ratios are highest in the Northwestern and Southeastern states. The Midwest states have the lowest load-to-truck ratios. For more details, visit Dat.com.

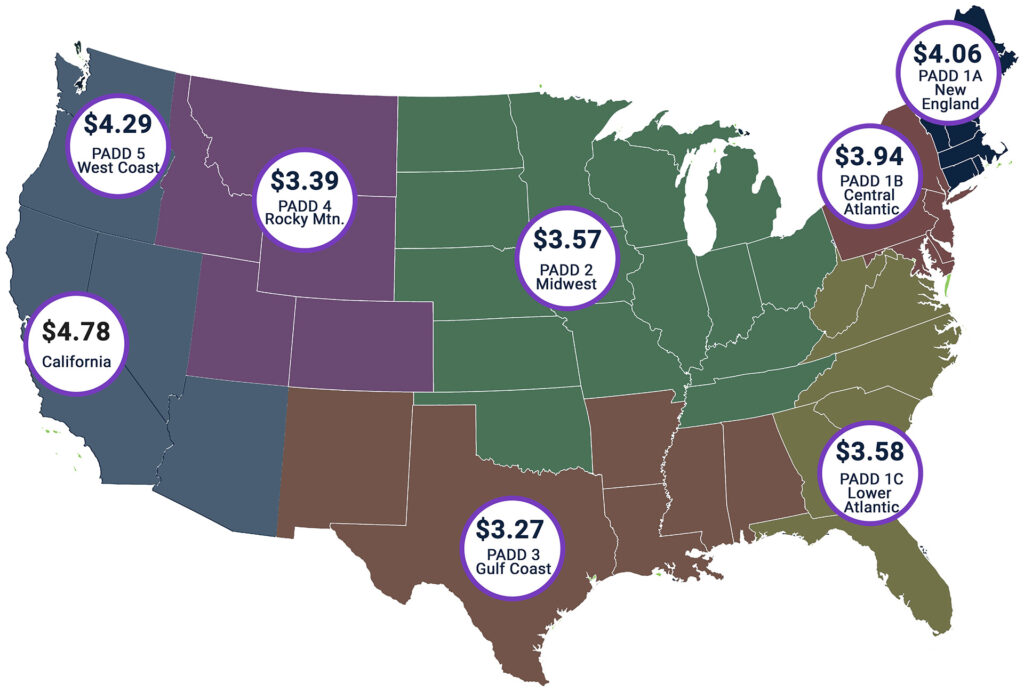
*Diesel fuel price map as of December 16, 2025
Checking fuel prices, the national average diesel price is $3.61 a gallon compared to $3.87 one month ago and is down 11¢ compared to one year ago.
East Coast diesel prices are averaging $3.70 per gallon. The average price in the Midwest is $3.57 per gallon. California diesel prices are averaging $4.78 per gallon.
| Change from | |||||
| 12/01/25 | 12/08/25 | 12/15/25 | Week Ago | Year Ago | |
| US | 3.758 | 3.665 | 3.607 | -0.058 | +0.113 |
| East Coast (PADD 1) | 3.785 | 3.729 | 3.703 | -0.026 | +0.128 |
| New England (PADD 1A) | 4.049 | 4.040 | 4.064 | +0.024 | +0.310 |
| Central Atlantic (PADD 1B) | 3.982 | 3.948 | 3.944 | -0.004 | +0.183 |
| Lower Atlantic (PADD 1C) | 3.687 | 3.617 | 3.580 | -0.037 | +0.093 |
| Midwest (PADD 2) | 3.755 | 3.635 | 3.567 | -0.068 | +0.117 |
| Gulf Coast (PADD 3) | 3.415 | 3.327 | 3.267 | -0.060 | +0.077 |
| Rocky Mountain (PADD 4) | 3.665 | 3.498 | 3.385 | -0.113 | +0.028 |
| West Coast (PADD 5) | 4.441 | 4.370 | 4.294 | -0.076 | +0.164 |
| West Coast less California | 4.026 | 3.944 | 3.871 | -0.073 | +0.145 |
| California | 4.919 | 4.862 | 4.781 | -0.081 | +0.184 |